Take the right decision at the right time
Key performance indicators like MTBF (Mean Time Between Failures) provide critical insights into equipment reliability, empowering maintenance managers to optimize operations and reduce downtime. With tools like DimoMaint MX Analytics, you can measure, analyze, and act on performance data to improve your maintenance strategy.
Much more than just a dashboard, DimoMaint MX Analytics is a key tool in your proactive management, offering you an innovative vision of your global activity. A solution that helps measure performance and facilitates decision-making, this module is an essential building block for managing your company’s maintenance activity.
Unlike a real-time operational analysis of your data, DimoMaint MX Analytics allows you to take a step back and make strategic decisions.
Effectively manage your maintenance activity

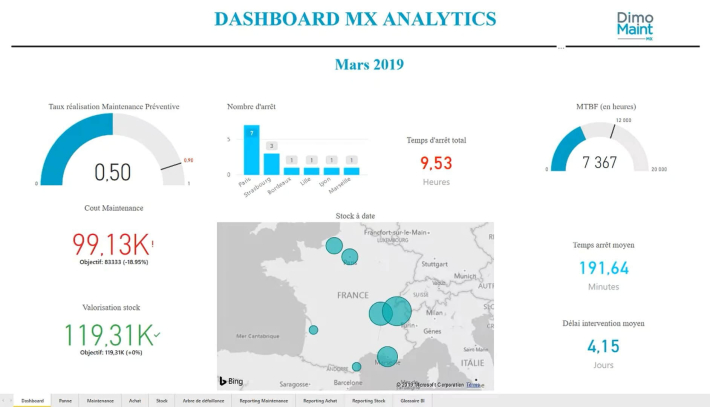
Access a dynamic dashboard of key indicators for your performance at specific times or periods of time.
Directly powered by data from your DimoMaint MX CMMS, the dashboard helps you achieve the following management objectives:
- evaluate your performance;
- diagnose a situation;
- communicate and inform.
Increase the availability rate of your equipment

Arrange the main indicators over a given period (MTTR, MTBF, number of shutdowns, duration of operation shutdowns, operation delay, etc.) and dynamically filter all these data by clicking on any site, equipment, brand, etc.
Reduce your maintenance costs by adopting the most appropriate maintenance strategy

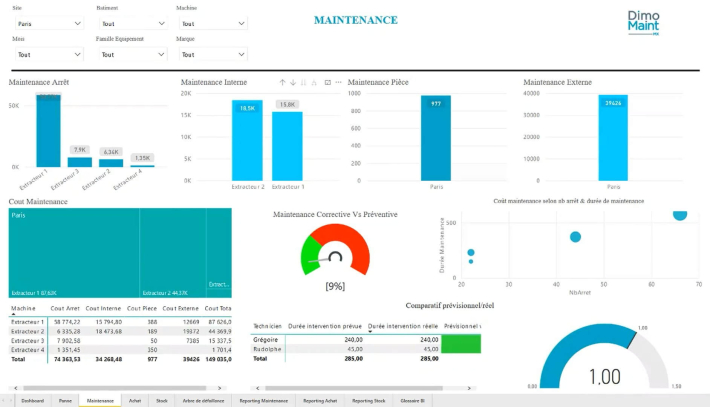
Analyze the origin and evolution of your maintenance costs (labour, parts, subcontracting, etc.) and examine the implementation of actions whose stakes will exceed the expenses generated by their implementation.
Easily identify deviations in a few clicks and control your costs by site, equipment, etc.
Efficiently manage your purchases (costs and deadlines)

Globally or specifically examine a store, delivery deadlines, delayed receipt of parts.
Obtain the relevant analyses to discuss the corrective actions to be implemented with your suppliers.
Improve your stock management

Prevent stock outs and focus your analysis on parts/items related to the most critical equipment, often out of stock or with high stock turnover.
Define or modify the correct supply method based on the type of item to be purchased and its use.
Acquire the valuation of your stocks and improve the way you manage your inventory.
Identify the main sources of failure and focus on the best technical solutions

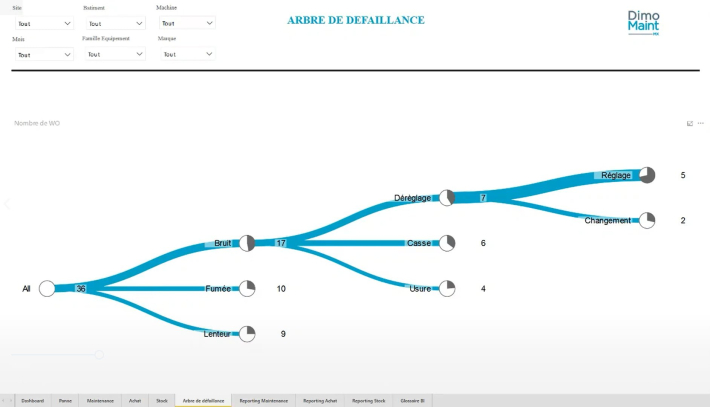
Identify and pinpoint major failures in order to examine them so you can correct them and avoid them in the future.
Visually identify the causes and remedies provided for these same failures.
Evaluate the criticality to better prioritize the various failures and better implement the necessary improvements, such as preparing and following up on a preventive action plan.
Refine your analyses with your data on breakdowns, stocks and exportable purchases in Excel

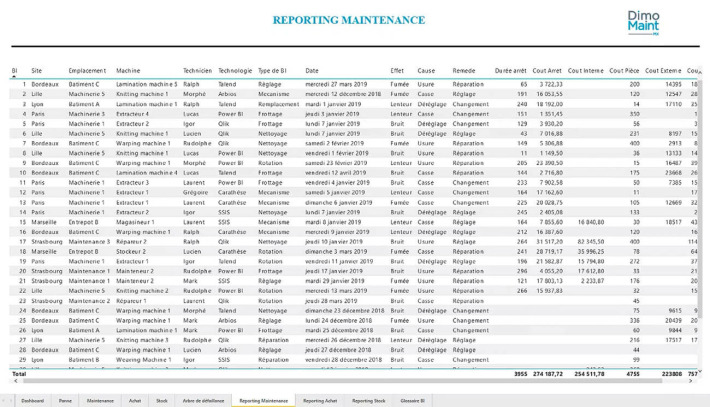
Access the most detailed DimoMaint CMMS maintenance, stock and purchase data, by work order.
Modify the calculations and perform more advanced analyses by simply extracting data in Excel.


