Step up with a Power BI module for aninteractive tool & in-depth analysis
Pinpoint the main causes of asset failure in a few clicks.
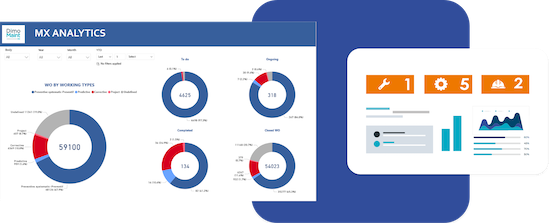
OM/MX Analytics is a Business Intelligence tool for multidimensional, dynamic analysis of your maintenance operations. OM/MX Analytics makes decisions easier.
Define your maintenance KPIs.
Customize your dashboard.
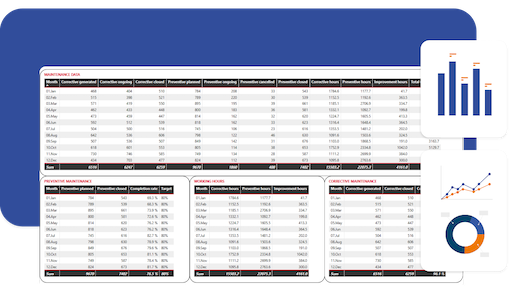
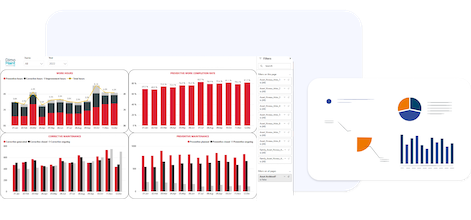
Evaluate your maintenance performance.
Customize & analyze your KPIs & dashboard
Filter your data by clicking on any site, asset, brand. Monitor:
Your main KPIs: MTTR, MTBF, availability rate, asset stops, overdue jobs, etc.
Maintenance costs.
Your budgets: OPEX / CAPEX.
Your supplies.
The activity of technicians and subcontractors.
Our implementation services
Dedicated team to analyze, develop and implement your KPIs.
Customization of your interface in line with your graphic charter.
Full integration with Microsoft environments (Power Automate and Office).
DimoMaint CMMS & System Integration
Gather, select, use and share your data easily.
DimoMaint helps you integrate CMMS with your existing solutions.